The Statistics page is divided into two sections. It displays the network interface counters as well as the traffic graphs of the wired and wireless interfaces.
The interface counters display a table of interface statistics.
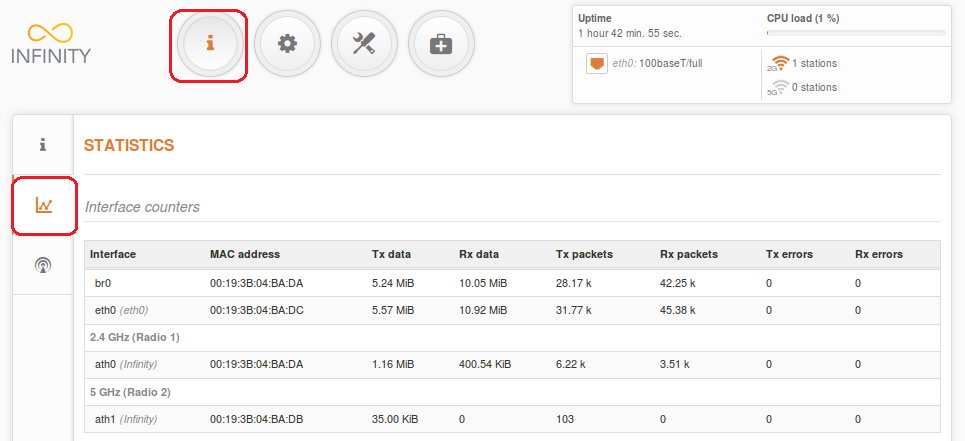
Interface – displays the radio interfaces, VAPs, and SSIDs (in brackets)
MAC address – displays the MAC address of a particular interface.
Tx data – displays the amount of transmitted data.
Rx data – displays the amount of received data.
Tx packets – displays the number of transmitted packets.
Rx packets – displays the number of received packets.
Tx errors – displays the number of TX errors.
Rx errors – displays the number of RX errors.
The Wireless page displays the receive/transmit statistics for the APs and the successfully-linked wireless clients (click the Counters tab to view the Rx/Tx information of the connected clients):
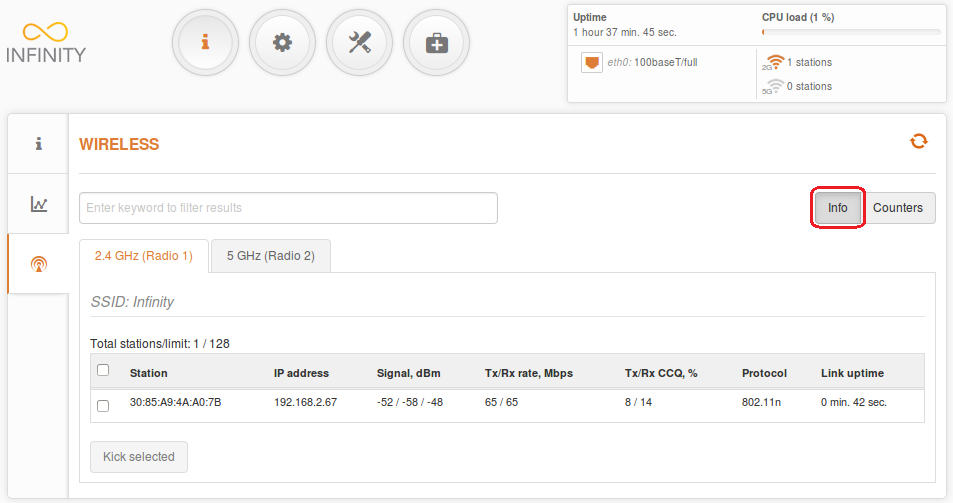
If the access point has more than one wireless interface (VAPs), the appropriate number of tables with the information about the connected wireless clients will be displayed.
Station – displays the MAC address and the friendly name of the successfully connected wireless client.
IP address – displays the IP address of the wireless client.
Signal – displays the signal strength of the access point’s main and auxiliary antennas that the station communicates with (in dBm).
Tx/Rx rate – displays the transmit/receive data rates (in Mbps).
Tx/Rx CCQ, % – displays the wireless Client Connection Quality (CCQ). The value (in percentages) shows how effectively the bandwidth is used with respect to the maximum possible bandwidth.
Protocol – displays the protocol, under which the access point communicates with a particular station.
Link uptime – displays the duration of a particular session.
Detailed Radio statistics per Peer:
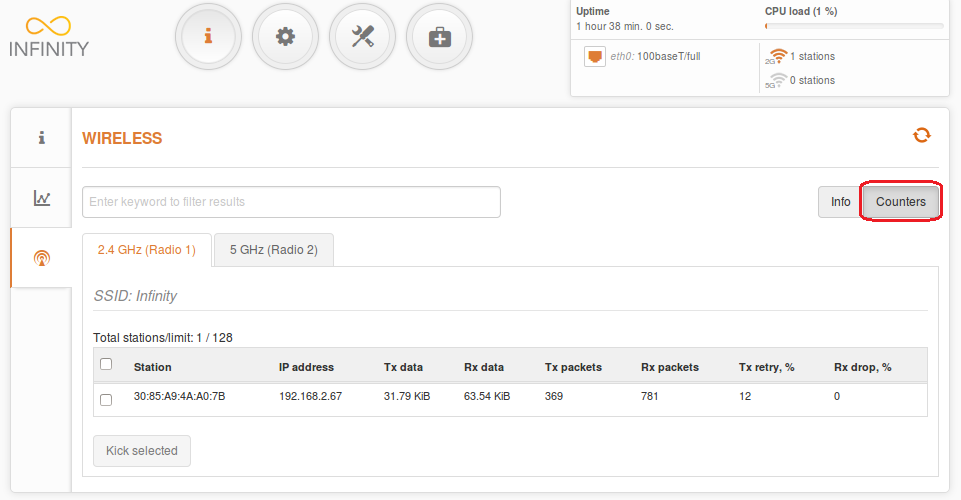
Station – displays the MAC address and the friendly name of the successfully connected wireless client.
IP address – displays the IP address of the wireless client.
Tx data – displays the amount of transmitted data.
Rx data – displays the amount of received data.
Tx packets – displays the number of transmitted packets.
Rx packets – displays the number of received packets.
Tx retry, % – displays the amount of retried packets (in percentages).
Rx drop, % – displays the amount of dropped packets (in percentages).